2026 · Novus Stream Solutions (hub)About 13 min readNovus Stream Solutions
Page speed and Core Web Vitals for a small site
Visitors leave slow pages before they read a word, and speed is a ranking factor too. The good news: most of what slows a small site is a handful of fixable things. Here is what Core Web Vitals measure and how to make a site fast in plain language.
Contents
- 1.Overview
- 2.What Core Web Vitals actually measure
- 3.What usually slows a small site down
- 4.The highest-leverage fixes
- 5.Measure before and after, without becoming an engineer
- 6.Loading the right things in the right order
- 7.The hidden weight of third-party scripts
- 8.Caching and the second visit
- 9.Test like your slowest visitor
- 10.Speed is a feature, not a chore
Overview
Speed is the part of a website that is invisible when it works and fatal when it does not. A visitor who waits too long for a page to load does not file a complaint; they simply leave, often before the page has even finished appearing, and you never know they were there. That silent abandonment is why page speed matters more than its low profile suggests: a meaningful share of the visitors your marketing worked to attract bounce on a slow page before reading a word, and faster pages keep more of them, convert better, and — because search engines use speed and the experience metrics around it as ranking signals — tend to rank better too. For a small site, where every visitor was hard to earn, losing them to slowness is among the most wasteful things that can happen.
The encouraging news is that page speed on a small site is usually not a deep engineering problem; it is a handful of common, fixable causes, and you do not need to be a developer to address the biggest ones. The industry has also given us a clear, standardized way to talk about the experience of speed — Core Web Vitals, a set of three metrics that measure how a page feels to load and use — which turns "the site feels slow" into specific, measurable problems with specific fixes. This guide explains what those three metrics actually measure in plain language, what typically slows a small site down, the fixes with the highest payoff for the least effort, and how to measure your own pages without turning into a performance engineer.
What Core Web Vitals actually measure
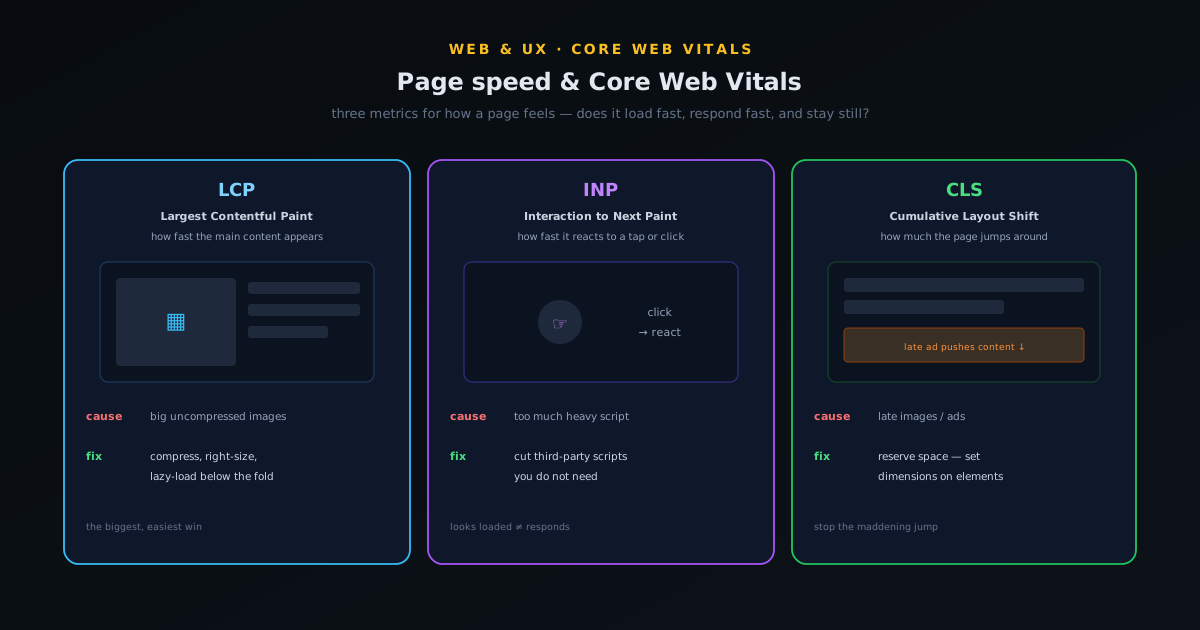
Core Web Vitals are three metrics that together capture the experience of a page loading and responding, and understanding what each one means makes them far less intimidating than their acronyms suggest. The first, Largest Contentful Paint (LCP), measures loading: specifically, how long it takes for the biggest, most important piece of content — usually the main image or heading — to appear, which is a good proxy for "how long until the page looks loaded to the visitor." A fast LCP means the page shows its main content quickly; a slow one means the visitor stares at a blank or half-built page, which is exactly when they leave. LCP is the metric most directly about the wait people feel.
The second, Interaction to Next Paint (INP), measures responsiveness: when a visitor clicks, taps, or types, how quickly does the page actually react? A page can look loaded but feel frozen if it does not respond promptly to input, and INP captures that lag between action and reaction. The third, Cumulative Layout Shift (CLS), measures visual stability: how much the page jumps around as it loads — the maddening experience of going to tap something and having it shift as a late-loading image or ad pushes the layout down. Together, LCP, INP, and CLS describe whether a page loads fast, responds fast, and stays still while doing it, which is most of what "feeling fast" actually means to a human. Each has a target range, and the goal is to land in the good zone on all three.
What usually slows a small site down
Before fixing anything, it helps to know where the time actually goes on a typical small site, because the culprits are remarkably consistent. The single most common cause of slowness is images: large, uncompressed images are heavy to download and are usually the biggest thing on the page, so they dominate both total load time and LCP. A site that drops in full-resolution photos straight from a camera or phone is shipping files many times larger than the page needs, and every one of those megabytes is time the visitor waits. Images are almost always the first place to look and the place where the biggest, easiest wins live.
The other frequent culprits are scripts and bloat. Third-party scripts — analytics, widgets, chat tools, ad and tracking code, social embeds — each add weight and often block the page or cause the layout shifts that wreck CLS, and they accumulate quietly until a site is carrying a dozen scripts it barely uses. Heavy themes and page builders that load far more code than a simple site needs add another layer, as does a slow host that takes too long to send the page in the first place. The pattern is that small sites are rarely slow because of one catastrophic problem; they are slow because of an accumulation of oversized images, unnecessary scripts, and bloated tooling, each adding a bit of delay. That is good news, because it means a few targeted cuts produce a noticeably faster site.
The highest-leverage fixes
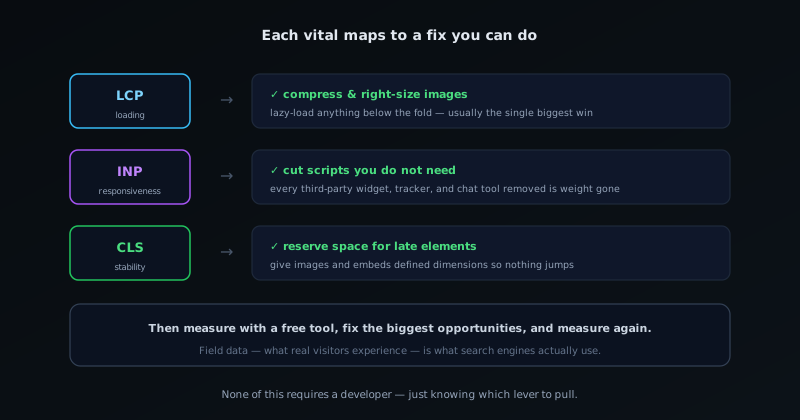
Given where the time goes, the fixes that matter most are clear and mostly within reach of a non-developer. Start with images, because that is where the biggest win usually is: resize images to the dimensions they are actually displayed at rather than serving huge originals, compress them at bgremover.novusstreamsolutions.com/tools/image-compressor so they are as light as possible without visible quality loss, and use a modern efficient format. This one step often cuts a page's weight dramatically and improves LCP directly. The ecosystem's practical walkthrough at How to compress an image without losing quality covers doing exactly this for free in the browser, including hitting a target file size — and lazy-loading images that are below the fold, so they load only as the visitor scrolls to them, keeps off-screen images from slowing the initial view.
After images, audit your scripts and cut what you do not need: every third-party tool you remove is weight and potential blocking removed, and most sites are carrying several they could lose without missing. Reserve space for elements that load late — giving images and embeds defined dimensions so the layout does not jump when they arrive — which fixes most CLS problems directly. And make sure basic delivery optimizations are on: caching so returning visitors do not re-download everything, and a decent host or a content delivery network so the page starts arriving quickly. None of these requires deep engineering; they require knowing that images, scripts, layout stability, and delivery are the levers, and pulling them. The compounding effect of a few of these fixes is usually the difference between a site that feels slow and one that feels fast.
Measure before and after, without becoming an engineer
You cannot improve what you do not measure, and the good news is that measuring page speed is free and does not require technical skill. Free tools will analyze any page, report its Core Web Vitals, give it a performance score, and — most usefully — list specific opportunities to improve it, often naming the exact oversized images and heavy scripts to address. Running your pages through one of these tools turns "the site feels slow" into a prioritized to-do list, and running it again after each fix shows you whether the change actually helped, which keeps you working on the things that move the numbers rather than guessing. The point is to let the tools tell you where the time goes instead of speculating.
There is an important distinction worth knowing: lab data (a test run in a controlled environment) versus field data (the speed real visitors actually experience on their real devices and connections). Field data is what ultimately matters and what search engines use, and the same tooling that reports your indexing also reports your real-world Core Web Vitals over time — covered alongside the rest of that toolset in Getting indexed faster in Google Search Console. The practical workflow is simple: measure a page, fix the biggest opportunities the tool names, measure again to confirm the improvement, and keep an eye on the field data to make sure real visitors are seeing the gains. Done a few times, this turns performance from a vague worry into a concrete, improving number, which is exactly what a small site owner needs rather than a deep dive into engineering.
Loading the right things in the right order
Beyond reducing how much a page weighs, a large share of perceived and measured speed comes from the order and manner in which things load, because a browser that is forced to fetch everything before showing anything feels far slower than one that shows the important content first. The technique is to identify what the visitor needs to see immediately — the text, the main image, the primary action — and let everything else load after, so the page becomes useful before it is complete. Deferring non-essential scripts and loading below-the-fold images only as the visitor approaches them are the everyday versions of this.
The opposite pattern — render-blocking resources that the browser must finish before it can paint — is one of the most common causes of a slow first impression, and it is often fixable without removing anything, just by changing when and how each resource loads. Lazy-loading images that are not yet on screen, in particular, is close to free and can transform a long image-heavy page, because the visitor never waits for pictures they have not scrolled to. Ordering the load so the page is usable early, then filling in the rest, is the same prioritise-the-important principle that governs perceived performance generally.
Caching and the second visit
Much of speed optimisation focuses on the first visit, but returning visitors are a large share of a healthy site traffic, and caching is what makes their experience near-instant. When a browser can reuse files it already downloaded — styles, scripts, images, fonts — rather than fetching them again, a repeat visit loads dramatically faster, and configuring your site so those files are cacheable is one of the higher-leverage things you can do for the people who come back. A site that re-downloads everything on every visit is leaving easy speed on the table.
A content delivery network extends the same idea across geography: by serving your files from locations physically closer to each visitor, it cuts the travel time of every request, which matters more the further your audience is from wherever your site is hosted. Neither caching nor a delivery network requires rebuilding anything; they are configuration that pays off continuously. For a small site, getting the cache settings right and putting static assets behind a delivery network is a one-time setup that quietly speeds up a large fraction of real visits without any ongoing effort.
Test like your slowest visitor
The most common reason a site feels fast to its owner and slow to its visitors is that the owner tests it on a fast computer, a fast connection, and a warm cache, which is the least representative possible setup. Real visitors arrive on a range of devices and connections, and a meaningful share are on mid-range phones over imperfect mobile networks — exactly the conditions under which an unoptimised site struggles most. Testing the way your slowest realistic visitor experiences the site, rather than the way you do, is what surfaces the problems that matter.
In practice this means checking the site on a throttled connection and a modest device, not just glancing at it on your own machine, and paying attention to the first visit with an empty cache rather than the fast repeat visits you see all day. The measurement tools that score Core Web Vitals can simulate these conditions, but actually loading the site on a real mid-range phone is sobering and clarifying in a way a score is not. Optimising for the slowest reasonable visitor lifts the experience for everyone, because the fixes that help a struggling device also help a fast one — they just matter less there.
None of this requires becoming a performance engineer, which is the encouraging part: the highest-leverage fixes for a small site are mostly a handful of repeatable habits — right-size the images, defer the non-essential, cache what you can, and test on a real phone — rather than deep technical work. A small site that simply avoids the common mistakes is already faster than most of its competitors, because most sites never do even the basics. Speed, on the modern web, is less about heroic optimisation than about not shipping the avoidable weight that slows everyone down, and that is well within reach of anyone willing to pay a little attention to it.
Speed is a feature, not a chore
It helps to reframe page speed from a technical chore you ought to get around to into a feature that directly serves your goals, because that reframing is what gets it prioritized. A fast site is not just nicer; it keeps more of the visitors you paid or worked to attract, converts more of them because they do not abandon mid-load, ranks better because the experience signals are favorable, and respects the many people visiting on phones and slower connections for whom a heavy site is genuinely painful. Every one of those is a business outcome, not an engineering nicety, which is why the small effort of the fixes above returns far more than its cost — speed is one of the rare improvements that helps acquisition, conversion, and ranking all at once.
The deeper point is that fast loading and a responsive feel are part of the product experience, not separate from it, in the same way that a tool feeling instant is part of whether people enjoy using it — the experience angle covered in Making a browser tool feel instant: the performance budget we hold. A visitor does not separate "the content" from "how fast it appeared"; they experience the whole thing as one impression, and a slow page taints good content with frustration before the content gets a chance. For a small site, where you rarely get a second visit from someone you lost, making the first load fast is among the highest-return investments available, and it is mostly a matter of compressing images, cutting scripts, stabilizing the layout, and measuring as you go. Treat speed as the feature it is, give it the modest effort it needs, and it quietly improves nearly everything else.
Frequently asked questions
Quick answers to common questions about this topic.
What are Core Web Vitals?
Three metrics that measure how a page feels to load and use: Largest Contentful Paint (LCP) — how fast the main content appears; Interaction to Next Paint (INP) — how fast the page responds to clicks and taps; and Cumulative Layout Shift (CLS) — how much the page jumps around while loading. Together they capture whether a page loads fast, responds fast, and stays stable.
What slows a small website down the most?
Usually large uncompressed images first — they are the heaviest thing on most pages and dominate load time. Then an accumulation of third-party scripts (analytics, widgets, chat, ads), heavy themes or page builders that load excess code, and a slow host. Small sites are rarely slow from one big problem; they are slow from many small ones.
How do I make my site faster without being a developer?
Start with images: resize them to the size they actually display, compress them without visible quality loss, use a modern format, and lazy-load below-the-fold images. Then cut scripts you do not need, give late-loading elements defined dimensions so the layout does not jump, and turn on caching and a decent host or CDN.
How do I measure my page speed?
Use a free page-speed tool that reports your Core Web Vitals, gives a performance score, and lists specific fixes — often naming the exact oversized images and heavy scripts. Measure, fix the biggest opportunities, then measure again. Field data (what real visitors experience) is what matters most and is also reported in Search Console.