2026 · Field notesAbout 12 min readNovus Stream Solutions
Online business KPI stack from zero: metrics you can run as a small team
A lean KPI framework for founders and operators who need fast decisions without enterprise analytics overhead.
Contents
- 1.Overview
- 2.Build the stack in layers
- 3.Review ritual
- 4.Common KPI mistakes and when to add new metrics
- 5.Making KPI reviews stick across the team
- 6.Interpreting metric relationships, not just individual numbers
- 7.Metrics hygiene: keeping data clean enough to trust
- 8.Why a lean stack beats a crowded dashboard
- 9.Input metrics versus output metrics
- 10.Match review cadence to the rate of change
- 11.Benchmark against yourself, not the industry
- 12.The stack should evolve with the business
Overview
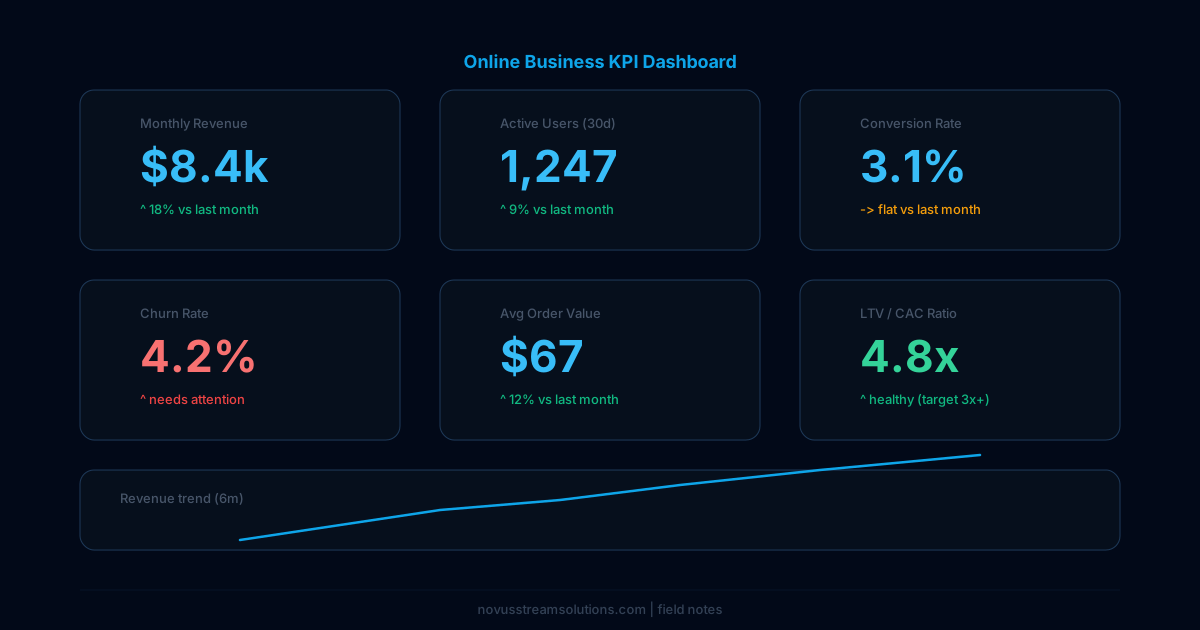
Small teams do not need fifty metrics. They need the few that explain movement in revenue quality and customer health. A lean KPI stack prevents dashboard sprawl and helps teams act faster.
Start with one KPI per lifecycle layer: acquisition quality, activation speed, retention behavior, and cash efficiency. Add complexity only when decisions actually demand it.
Build the stack in layers
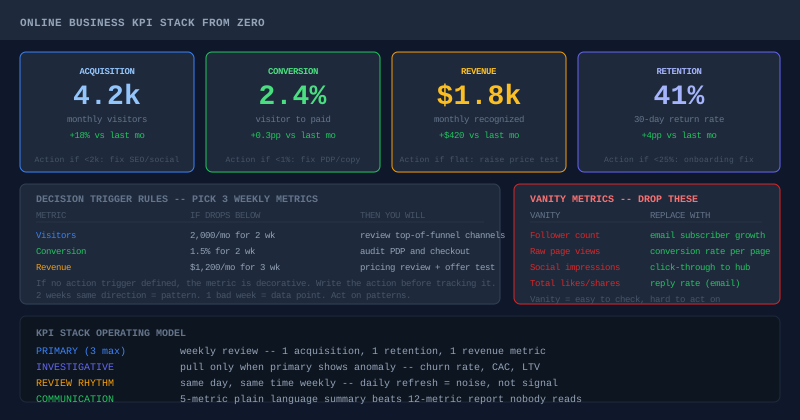
Layer 1 is demand quality (qualified leads or intent sessions). Layer 2 is first value event. Layer 3 is repeat behavior. Layer 4 is contribution margin and runway impact.
Every KPI should have an owner and review cadence. No owner means no action, and no action means the metric is vanity.
Review ritual
Run a weekly KPI review with explicit decisions and one-page notes. Over time this becomes your operating memory and reduces reactive planning.
The review ritual is not about the data — it is about the discipline of returning to the same questions every week regardless of how the week felt. Founders who skip the review during busy weeks miss it exactly when they need it most. High-activity periods are precisely when decisions get made under pressure without a clear view of whether the underlying metrics support the direction. A 30-minute weekly review that happens even in compressed weeks is worth more than a comprehensive two-hour review that happens occasionally when things feel slow.
Structure the review the same way every week so it becomes automatic rather than effortful. Same format, same questions, same order. The structure is not about bureaucracy — it is about reducing cognitive load so the mental energy goes into interpreting the numbers rather than remembering what to look at. After 8 to 10 consistent weeks, the review becomes a reflex and the quality of the analysis improves because context accumulates. You start to see weekly numbers in relation to the previous six weeks rather than in isolation, which is where the real pattern recognition happens.
- Fix the day and time for the weekly review and treat it as non-negotiable — skip it only if the business is not operating.
- Use the same one-page template every week so the format never requires thought.
- Write one sentence of context for any metric that moved significantly — future-you will thank present-you.
Common KPI mistakes and when to add new metrics
The most common KPI mistake is tracking what is easy to export from your analytics platform rather than what drives decisions. Pageviews, follower counts, and email open rates all produce numbers that feel like progress but rarely trigger a specific action. Ask for each metric you track: "If this number drops by 20 percent next week, what would I do differently?" If the answer is "nothing specific," the metric does not belong in your weekly review.
Add a new metric to your stack only when you have a specific decision it will improve. A common trigger is when you notice a pattern you cannot explain with your current metrics — a revenue number moving in a direction that your acquisition and retention metrics do not account for. That unexplained gap is the right moment to add one new measurement. Adding metrics in response to confusion is appropriate; adding metrics proactively "just in case" creates noise that obscures the signals you actually need.
- Before adding a metric, write down the exact decision it will inform and who owns reviewing it.
- Remove any metric you have not acted on in the last 90 days — it is measuring without value.
- Run a quarterly KPI audit: one metric to add, one to remove, one to redefine if the business has changed.
Making KPI reviews stick across the team
A KPI stack is only useful if the team actually uses it. The most common failure mode is a weekly review that becomes a passive readout — numbers are shared, nobody commits to a decision, and the meeting ends without a next action. The fix is a forced decision format: the final five minutes of every review must produce at least one explicit "we will do X" or "we will stop doing Y" before the meeting closes. Reviews that end in observations rather than commitments are not reviews — they are reporting.
Distribute the review ownership across team members rather than centralizing it in the founder or a single analyst. When the person responsible for acquisition presents their own acquisition metric, they bring context, not just data. That context is where the real insight lives. Rotate ownership of different metrics to build organizational fluency — a team where everyone understands the key numbers is more resilient than one where a single person holds all the analytical knowledge.
Interpreting metric relationships, not just individual numbers
Individual metrics tell you what; metric relationships tell you why. If your acquisition metric is improving while your retention metric is declining, you may be attracting a different — and lower-quality — type of customer through your growth activities. If your revenue is growing but your contribution margin is declining, you may be growing in lower-margin product lines without noticing the mix shift. These stories only emerge when you look at metrics in relation to each other, not when you track them in separate weekly check-ins.
Build a small set of metric relationships to monitor alongside the individual KPIs. Useful pairs include activation rate alongside acquisition volume (are you converting a stable percentage of people you acquire?), retention rate alongside net revenue retention (are customers who stay also spending more?), and customer acquisition cost alongside customer lifetime value (is the LTV:CAC ratio sustainable as you grow?). These ratios compress a lot of information into a single number and make trend spotting faster.
Metrics hygiene: keeping data clean enough to trust
Metrics are only useful when they accurately measure what they claim to measure. Data hygiene — the practice of keeping your measurement systems accurate and consistent — is the unglamorous foundation of any trustworthy KPI stack. Tracking scripts that stop firing, attribution windows that change when you update a tool, duplicate customer records that inflate counts, and revenue figures that lag behind actual payments are all hygiene failures that produce numbers people stop trusting.
Build a monthly data hygiene check into your review process. Spot-check two or three metrics against their source data rather than just accepting the aggregated number. When a metric moves unexpectedly, verify whether the movement is real or whether it reflects a measurement change. A 30% spike in new user registrations is interesting if it reflects actual behavior; it is a false alarm if it reflects a duplicate event from a misconfigured analytics trigger. Teams that can distinguish between real signal and measurement noise make better decisions than teams that cannot.
Why a lean stack beats a crowded dashboard
The instinct when building a metrics practice is to track everything available, on the theory that more data is more insight, but for a small team the opposite is true: a lean stack of a few decision-driving metrics beats a crowded dashboard of many. Every metric on a regular view imposes a cognitive cost — it has to be interpreted, contextualized, and either acted on or consciously set aside — so a dashboard with fifty metrics demands fifty small interpretive efforts, most of which lead nowhere, and the few signals that matter get lost in the noise. A small team does not have the analytical capacity to extract value from a crowded dashboard, so the crowding actively degrades decision quality rather than improving it.
A lean stack works because it concentrates attention on the metrics that actually move revenue quality and customer health, which are few. Starting with one key metric per lifecycle layer — acquisition quality, activation, retention, cash efficiency — gives a small team enough to run the operation, and that focus is what makes the metrics usable. Complexity should be added only when a specific decision demands it, not preemptively in case it might be useful, because preemptive metrics become noise that obscures the signals you need. The discipline of keeping the stack lean — resisting the accumulation of metrics that feel informative but never drive a decision — is what keeps the metrics practice actually informing decisions rather than overwhelming the operator with data they cannot use. Fewer metrics, each connected to a decision, is more valuable than many metrics connected to nothing.
Input metrics versus output metrics
A distinction that sharpens a metrics practice is between input metrics, which measure actions you control, and output metrics, which measure results you can only influence. Revenue is an output; the activities that drive it — qualified leads generated, activation rate, retention behavior — are inputs that lead to it. Output metrics tell you where you stand but not what to do, because by the time they move, the actions that drove them are past; input metrics tell you whether you are doing the things that produce the outputs, while there is still time to adjust. A practice that watches only outputs is informed but late; one that watches the right inputs can act before the output is determined.
For a small team, building the stack around input metrics that you can actually move is what makes the metrics actionable rather than merely descriptive. An output metric moving in the wrong direction is a problem you can only respond to after it has happened; an input metric moving in the wrong direction is an early warning you can act on. The skill is identifying which inputs reliably drive your key outputs — which leading activities precede the lagging results — and watching those closely, treating the outputs as confirmation rather than as the primary signal. This input focus is what turns a metrics practice from a scoreboard that tells you the result into a control panel that lets you affect the result, which is the difference between measuring the business and steering it. Watch the inputs you control to influence the outputs you care about.
Match review cadence to the rate of change
A metrics practice should review each metric at a cadence matched to how fast that metric actually changes, rather than reviewing everything at the same frequency. Some metrics move meaningfully week to week and warrant a weekly review; others — structural ratios, slow-moving retention curves — change so gradually that a weekly check produces only noise, and a monthly or quarterly cadence is more appropriate. Reviewing a slow-moving metric too frequently wastes attention on variation that is not yet meaningful, while reviewing a fast-moving one too infrequently misses the window to respond. Matching cadence to change rate is what keeps the review efficient, putting attention where movement is actually occurring.
This cadence-matching also keeps the regular review lean, because not every metric belongs in the weekly view. The metrics that change weekly and drive weekly decisions belong in the weekly review; the slower metrics belong in a monthly or quarterly check, where their gradual movement becomes visible without cluttering the frequent review. Sorting metrics by their natural cadence — weekly for the volatile drivers, less often for the structural indicators — produces a tiered review practice that respects both the attention budget and the nature of each metric. The operator who reviews fast metrics weekly and slow metrics quarterly sees each at the resolution where it carries signal, while the operator who reviews everything weekly drowns the slow signals in noise and the operator who reviews everything quarterly misses the fast ones. Cadence is a dimension of the metrics practice as important as which metrics you choose, and matching it to the rate of change is what makes the practice both responsive and uncluttered.
Benchmark against yourself, not the industry
For a small operation, the most useful benchmark for a metric is almost always its own history rather than an industry average, because industry benchmarks are built from businesses with different models, stages, and audiences whose averages may have little relevance to your specific situation. A conversion rate that is below an industry benchmark might still represent strong progress for your business if it has been steadily improving, while a rate above the benchmark might be declining in a way the favorable comparison hides. Anchoring on your own trajectory — is this metric better than it was, trending the right way — measures the thing you can actually affect, which is your own progress, and controls for everything specific to your situation that an external benchmark ignores.
Benchmarking against yourself also avoids the demoralization or false comfort that external benchmarks can produce. Comparing your early-stage numbers to a mature competitor's guarantees you feel behind regardless of your actual progress, while finding a weak benchmark to compare favorably against provides comfort disconnected from your real trajectory. Your own historical trend is immune to this cherry-picking, because it asks the only question that matters for action: are the things you are doing moving your metrics in the right direction. Industry benchmarks have a place as an occasional sanity check on whether your numbers are in a plausible range, but for the week-to-week and month-to-month work of improving the operation, your own past is the benchmark that informs decisions you can actually act on. Measuring against yourself keeps the focus on the improvement you control rather than on a comparison that may be neither fair nor relevant.
The stack should evolve with the business
The right metrics for a business at one stage are often the wrong metrics at another, which means the KPI stack should be revisited periodically and updated as the business evolves rather than treated as a fixed set chosen once. A business in a growth phase watches different leading indicators than one in a retention phase; a business with a new product line needs metrics its mature product never required. A stack that never changes will, over time, drift out of alignment with what the business actually needs to watch, continuing to track the signals that mattered at an earlier stage while missing the ones that matter now. Periodic review of not just what the metrics say but whether they are still the right metrics is what keeps the stack relevant.
A practical discipline is a quarterly review that asks the meta-question — are these still the right numbers to track — and adjusts the stack by adding a metric a new decision now requires, removing one that no longer drives any decision, and redefining any that the changed business has made ambiguous. This keeps the stack lean as well as relevant, because metrics that have become disconnected from decisions get retired rather than accumulating into clutter. The stack is an operating tool, and operating tools should fit the current operation rather than a past one, so reviewing and evolving the metric set as the business changes is part of maintaining a useful metrics practice. A stack that evolves with the business stays a sharp instrument for the decisions that currently matter; a static stack slowly becomes a measurement of the business you used to be rather than the one you are running now.
Frequently asked questions
Quick answers to common questions about this topic.
What KPIs should a small online business track?
A short stack tied to the funnel: traffic, conversion, average order or revenue, and retention. A few metrics that connect to revenue beat a sprawling dashboard nobody acts on.
How do you build a KPI system with no data team?
Start with the metrics your existing tools already report, review them on a fixed cadence, and only add a metric when it would change a decision. Simplicity is what makes the stack sustainable.